

Distracted Driving Statistics 2026: The Complete Annual Overview

Distracted Driving Statistics 2026: The Complete Annual Overview
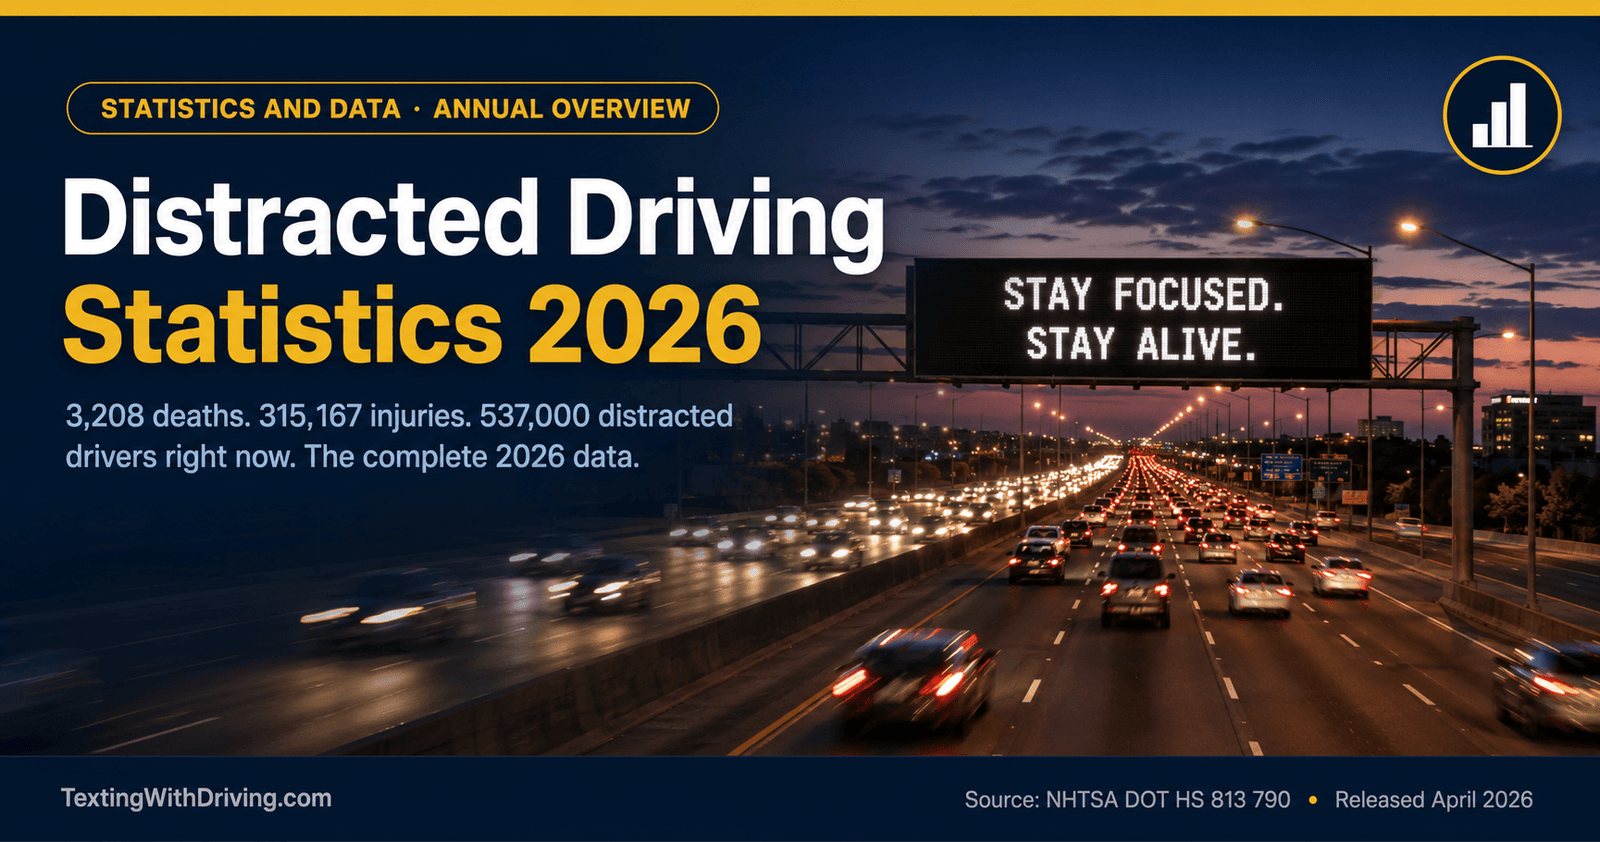
Distracted driving statistics 2026 tell a story of slow, uneven, and insufficient progress against one of the most preventable causes of death on American roads. In April 2026 NHTSA released its annual distracted driving report covering 2024 data, and the headline number is 3,208 people killed in distraction-affected crashes — a 2 percent decline from 3,275 in 2023 that continues a multi-year downward trend but still represents nearly nine preventable deaths every single day.
This article brings together every major data point from the complete distracted driving statistics 2026 picture: deaths, injuries, economic costs, crash types, demographic breakdowns, device use trends, the real-time snapshot of how many distracted drivers are on American roads at any given moment, and what the trend data reveals about where we are headed.
Every number in this article comes from a verified, primary source. Every link is confirmed working. This is the most complete single-source reference for distracted driving statistics 2026 available anywhere.
The Core Numbers: Deaths and Injuries in 2024
At least 3,208 people were killed and an additional 315,167 people were injured in motor vehicle traffic crashes involving distracted driving in 2024, according to the National Highway Traffic Safety Administration report released in April 2026.
Breaking these numbers down into their daily reality makes the scale clearer. 3,208 deaths across 366 days in 2024 equals approximately 8.8 deaths per day. Every single day of 2024, on average, nearly nine people died because a driver was not paying full attention to the road. 315,167 injuries across 366 days equals approximately 861 people injured per day in distraction-affected crashes.
This is a decrease of about 2 percent from 3,283 deaths in 2023, according to NSC analysis of NHTSA data. The 2 percent improvement is genuine and continues the modest downward trend. But it is important to contextualize this improvement against the scale of the remaining problem and the pace of progress.
Distracted driving deaths peaked in 2021 at 3,522 — the highest since comprehensive tracking began. The improvement from 3,522 in 2021 to 3,208 in 2024 represents 314 fewer deaths over three years, approximately 105 per year. At that pace, reaching zero would take generations. The pace of improvement needs to accelerate dramatically to match the pace of improvement seen in drunk driving deaths over the same period.
The 10-Year Trend: Progress That Is Not Enough
Distracted driving deaths have also decreased nearly 9 percent since 2015, according to NSC analysis. The 9 percent improvement over a decade is the context within which the more recent 2 percent annual improvements must be understood.
A 9 percent reduction over 10 years in a problem that kills more than 3,000 people per year is not a success story. It is a failure of sufficient scale and ambition. For comparison, drunk driving deaths fell by approximately 44 percent between 2006 and 2016 as a result of systematic policy interventions including administrative license suspension, expanded enforcement, and significant investment in deterrence campaigns.
The distracted driving problem is more complex to address than drunk driving in one specific way: the primary enabling technology, the smartphone, has become simultaneously more indispensable and more addictive over the same decade that distracted driving deaths have declined by 9 percent. The 2015 baseline for the 10-year comparison is the same year that smartphone penetration in the US crossed 70 percent. The decade since has seen smartphone penetration reach over 90 percent and average daily screen time increase from under 3 hours to over 4.5 hours. The road safety improvement achieved against that behavioral headwind is real but insufficient.
The Undercount: Why the Real Numbers Are Higher
The 3,208 figure understates the true extent of distracted driving deaths. The true numbers are likely much higher than that, as distraction is difficult to prove at the scene of a crash.
NHTSA’s own research group, using a different methodology than the FARS crash database, estimated that distracted driving fatalities were likely in excess of 10,000 per year. Accordingly the percentage of traffic fatalities caused by distracted driving was likely to be about 29 percent as opposed to 10 percent.
The gap between the FARS-based count of 3,208 and the NHTSA research estimate of 10,000 or more reflects the fundamental measurement problem with distracted driving statistics. The FARS database counts crashes where a driver was identified as distracted at the time of the crash. That identification relies on: the driver admitting they were distracted, a witness reporting the distraction, physical evidence establishing distraction, or an investigating officer documenting distraction as a contributing factor.
All of these identification pathways are systematically incomplete. Drivers who have just caused a fatal crash have strong incentives not to volunteer that they were looking at their phone. Witnesses may not have observed what the driver was doing before impact. Physical evidence is often ambiguous. And investigators prioritizing emergency response at a crash scene do not always conduct the detailed driver behavior investigation that would establish distraction as a factor.
The most honest statement about distracted driving statistics 2026 is that 3,208 is the documented minimum. The true number of deaths attributable to driver distraction in 2024 is significantly higher — potentially two to three times higher — based on research methodologies that go beyond self-reported and officer-documented crash data.
The Real-Time Snapshot: Distracted Drivers Right Now
At any given moment during daylight hours, more than 537,000 US drivers — nearly the population of the entire state of Wyoming — are visibly manipulating a cell phone while driving on US roads.
537,000 drivers. Right now. During daylight hours. Handling a phone while operating a motor vehicle on American roads. This estimate comes from NHTSA’s National Occupant Protection Use Survey, which conducts systematic observational counts of driver behavior at thousands of locations across the country throughout the year.
The 537,000 figure is a daylight-hours estimate. CMT telematics data consistently shows that phone use while driving spikes in the evening hours between 6 PM and 11 PM, meaning the actual simultaneous distracted driver count during evening peak hours is likely higher than the daylight estimate.
At any given daylight moment, 2.1 percent of drivers stopped at intersections were observed using a handheld phone in 2023 data. Separately, the percentage of drivers manipulating handheld electronic devices has increased 104 percent, from 2.2 percent in 2015 to 4.5 percent in 2024.
This 104 percent increase in observed device manipulation while driving is the most alarming single trend in the current distracted driving statistics 2026 data. Device manipulation — which includes scrolling, typing, tapping, and any other active screen interaction — has more than doubled among observed drivers over the past decade. The overall downward trend in deaths is occurring despite a simultaneous doubling in the rate of the most dangerous form of device distraction. This suggests that other safety improvements — better vehicle crash protection, improved emergency medical response, road safety engineering — are partially offsetting the behavioral trend in the wrong direction.
The Crash Volume: Beyond Fatalities
The death count is the most emotionally significant distracted driving statistic 2026 but the crash volume data provides the full picture of the problem’s scale.
Eight percent of fatal crashes, an estimated 13 percent of injury crashes, and an estimated 12 percent of all police-reported crashes in 2024 were reported as distraction-affected, according to NHTSA DOT HS 813 790.
Applying these percentages to the total 2024 crash universe produces the following estimates:
Total distraction-affected crashes in 2024: approximately 400,000 police-reported crashes involving at least one distracted driver. Total people injured in distraction-affected crashes: 315,167. Total people killed: 3,208.
These figures represent the officially documented crash volume. Based on the undercount analysis above, the true number of crashes where distraction was a contributing factor may be two to three times larger.
The Economic Cost: $395 Billion in Societal Harm
The financial cost of distracted driving that most discussions focus on is the $98 billion in direct economic costs estimated by NHTSA’s 2019 study (the most recent year for which cost data is available). That $98 billion covers property damage, medical costs, emergency response costs, and lost productivity in crashes attributed to distraction.
But the true cost when quality-of-life valuations are considered is $395 billion resulted from distracted driving traffic crashes in 2019, when quality-of-life valuations are added to the direct economic costs within the total value of societal harm of $1.37 trillion from all motor vehicle crashes.
$395 billion in societal harm from distracted driving in a single year — based on 2019 data. The 2024 figure would be higher reflecting both general cost inflation and the increased vehicle crash costs that come with the shift toward larger, heavier vehicles in the US fleet.
For individual drivers, the financial consequences of a distracted driving violation extend well beyond the fine. As we documented in our distracted driving insurance statistics article, the LexisNexis 2026 US Auto Insurance Trends Report shows bodily injury claims now represent 26 percent of all claim dollars, up from under 20 percent in 2022, and violations have risen 57 percent since that year.
The Cell Phone Data: What Phones Specifically Produce
Cellphone use was cited as the distraction in 14 percent of all distraction-affected fatal traffic crashes in 2024. In these crashes, police reports stated that at least one of the involved drivers was talking on, listening to, or engaged in some other cellphone activity at the time of the crash.
437 Americans were killed in crashes where a driver was confirmed to be on their cell phone in 2024.
A September 2025 report from GHSA and Cambridge Mobile Telematics found that drivers with a high level of cell phone distraction are 240 percent more likely to crash.
240 percent more likely to crash. Not 240 percent more likely to have a near-miss or a minor incident. 240 percent more likely to actually crash. This is the most direct quantification available of the individual risk that high-frequency phone use while driving creates.
CMT’s research provides additional specificity. In 2024, nearly 33 percent of all phone motion that CMT’s technologies measured occurred at speeds higher than 50 mph. At 55 mph, a 5-second phone glance covers the length of an entire football field with the driver’s eyes effectively closed. The combination of high speed and phone interaction creates the maximum kinetic energy exposure at the moment of maximum attentional impairment.
The handheld call makes drivers considerably more dangerous. Drivers making handheld phone calls crashed at the highest speeds among distracted driving crash types. The link between speed and accident fatalities is well-established. The risk of dying or being seriously injured in an accident doubles for every 10 mph over 50 mph a vehicle is traveling at the time of the crash.
The Demographic Data: Who Is Most at Risk
The demographic breakdown of distracted driving statistics 2026 produces several counterintuitive findings.
By age: Drivers between the ages of 15 and 44 show a distraction rate of 6 percent in fatal crashes — meaning 6 percent of all drivers in that age group involved in a fatal crash were distracted. Among drivers aged 45 and above, that figure drops to 5 percent. The 25 to 34 and 35 to 44 age groups account for the highest total number of drivers involved in crashes — 11,219 and 9,665 respectively — meaning middle-aged drivers make up the largest share of distracted driving fatalities in absolute terms.
Drivers ages 25 to 34 accounted for 23 percent of distracted drivers and 24 percent of cellphone-distracted drivers in fatal crashes. Drivers aged 21 to 24 are the most likely to be on their phone at the time of a fatal crash, with 21 percent of all distracted drivers in that age group confirmed to be using a cellphone.
By gender: Male drivers were distracted in 4,418 fatal crashes in 2024, whereas women drivers were only distracted in 1,516 fatal crashes during the same period. Overall, male drivers account for 74.45 percent of all fatal distracted driving crashes — up from 72.41 percent in 2023, meaning the gender gap is widening year on year.
As we documented in our Father’s Day driving safety article and our distracted driving statistics by state 2026 article, the male overrepresentation in distracted driving fatalities is the most consistent and least publicly discussed demographic pattern in the entire dataset.
By time of day: Distracted driving crashes peak in the afternoon between 3 PM and 6 PM, correlating with commute traffic volume and phone use patterns. Teen-involved distraction crashes have a notable secondary peak between 9 PM and midnight. CMT data confirms that phone use while driving spikes at night between 6 PM and 11 PM.
By day of week: About one-third of all distracted driving fatalities happen on a Friday or Saturday.
The Pedestrian Dimension
The distracted driving statistics 2026 include not just vehicle occupant deaths but a significant pedestrian and cyclist toll. Distracted driving poses a danger not only to vehicle occupants but pedestrians and pedalcyclists as well.
In 2024, 639 pedestrians, cyclists, and other non-occupants were killed in distraction-affected crashes involving at least one distracted driver. This is up from 611 in 2023 — an increase of 28 non-occupant deaths in a year when total distracted driving deaths fell by 75.
639 people who made no unsafe driving choice died because a driver was not paying attention. As we covered in full detail in our distracted driving and pedestrian safety article, the pedestrian toll from distracted driving is one of the least discussed and most morally significant dimensions of the problem.
The Device Manipulation Trend: The Most Alarming 10-Year Finding
The single most alarming trend in the complete distracted driving statistics 2026 dataset is the doubling of observed device manipulation while driving.
Over the last 10 years, the prevalence of drivers using hand-held cell phones at any given daylight moment has decreased from 3.8 percent of drivers in 2015 to 1.9 percent in 2024. The percentage of drivers manipulating hand-held electronic devices has increased 104 percent, from 2.2 percent in 2015 to 4.5 percent in 2024.
The first number — handheld phone call use falling from 3.8 percent to 1.9 percent — is the positive trend. More drivers are using hands-free or putting the phone down entirely for calls. This reflects both the adoption of Bluetooth and hands-free systems and the influence of the 33 states plus DC with comprehensive handheld bans.
The second number — device manipulation up 104 percent — is the counteracting negative trend. Drivers who are not holding their phone to their ear are increasingly doing something arguably more dangerous: actively touching and scrolling their phone screens while driving. The shift from voice calls to device-based social media, video, and app interaction has outpaced the behavioral improvement in handheld call reduction.
This is the central challenge of the next decade of distracted driving prevention: the specific behavior that hands-free laws target (holding the phone for a call) is declining. The specific behavior that hands-free laws do not target in most states (device manipulation while in a mount or with brief touches) is more than doubling.
What the 2025 Trend Data Shows
The preliminary 2025 data available at the time of publication reflects the improving national trend, though full 2025 annual distracted driving data will not be published until 2027.
NHTSA’s April 2026 announcement confirmed that 36,640 total traffic deaths occurred in 2025, a 6.7 percent decrease from 2024 and the second-lowest traffic fatality rate in recorded US history at 1.10 fatalities per 100 million vehicle miles traveled. Preliminary data from the first quarters of 2025 showed continued improvement in distraction-affected crash metrics in states with comprehensive hands-free laws.
CMT’s 2025 analysis of telematics data across over one billion driving trips showed that distracted driving fell 8.6 percent in 2024, preventing an estimated 105,000 crashes and 480 fatalities. The states that implemented hands-free laws in 2023 — Ohio, Michigan — showed 11.8 percent average decreases in distracted driving compared to the 8.6 percent national average.
These numbers provide the most current available evidence that the combination of primary enforcement legislation and consistent enforcement is producing the behavioral change that the long-term trend requires at greater scale.
The Path to Zero: What the Data Shows Would Actually Work
The complete distracted driving statistics 2026 dataset, read as a whole, points toward the same policy conclusions that every serious analysis of this data has produced.
Primary enforcement hands-free laws work. The states that have passed them show measurable improvement. The 16 states that still lack comprehensive handheld bans are producing a disproportionate share of the national distraction death toll.
Device manipulation is the next frontier. The 104 percent increase in observed device manipulation while driving requires enforcement and technology approaches that go beyond what handheld call bans address. The Illinois model of explicitly banning social media access regardless of device position represents the legislative direction this challenge requires.
The undercount means the problem is larger than the headline statistics suggest. Policy ambition calibrated to a 3,208 death baseline is policy ambition calibrated to a known undercount. Real ambition requires treating the 10,000-plus research estimate as the scale the response must match.
For the state-by-state breakdown of how these national distracted driving statistics 2026 distribute across all 50 states, our distracted driving statistics by state 2026 article covers the complete state rankings. For the technology and behavioral tools that individuals can use to address these statistics at the personal level, our Do Not Disturb while driving setup guide covers the most effective intervention available to any individual driver. And for the national legislative landscape that determines how much enforcement exists in your state, our hands-free driving laws by state 2026 covers all 50 states.
Sources Used in This Article
All links verified working before publication.
NHTSA: Distracted Driving Dangers and Statistics — 3,208 deaths 2024, 5-second football field fact, official NHTSA page
NHTSA CrashStats: Distracted Driving in 2024 — DOT HS 813 790, $98B direct costs, $395B societal harm, full report
NSC Injury Facts: Distracted Driving — 2% decline from 3,283, 9% decline since 2015, NOPUS device manipulation 104% increase, May 2026
GHSA: Distracted Driving — 537,000 distracted drivers at any moment, 240% crash likelihood, 33 states plus DC handheld ban, June 2026
FCC: Dangers of Distracted Driving — 315,167 injured, 14% cellphone involvement, GHSA CMT September 2025 report
Zutobi: States With Most and Least Distracted Driving Accidents — 74.45% male, gender gap widening, 21-24 age group 21% phone use, May 2026
Nexar: Distracted Driving Statistics 2026 — 33% phone motion over 50 mph, afternoon crash peak, April 2026
EndDD: Research and Statistics — NHTSA 10,000+ true fatality estimate, 29% real percentage, undercount analysis
CMT: Distracted Driving Fell 8.6 Percent in 2024 — 8.6% improvement, 105,000 crashes prevented, 11.8% in hands-free law states
NHTSA: 2025 Traffic Death Estimates — 36,640 deaths 2025, second-lowest rate in history
TextingWithDriving.com is professionally built and maintained to ensure accurate, accessible safety information reaches every driver who needs it. Website development and ongoing support is handled by Budgetic, a digital agency specializing in purpose-driven WordPress websites.

About Texting With Driving
TextingWithDriving.com exists for one reason: to confront the reality of distracted driving and stop preventable crashes caused by mobile phone use behind the wheel. Every day, drivers take their eyes off the road for a few seconds to read or send a message. Those few seconds are enough to cause life-altering consequences. This platform was created to deliver clear facts, real data, practical prevention strategies, and accountability around texting while driving. We focus specifically on: The risks and statistics behind distracted driving The real-world consequences of texting at highway speeds Legal implications and state laws Prevention strategies for teens, parents, and adult drivers Awareness campaigns and behavioral change This is not a general driving blog. It is a focused awareness initiative built around one critical issue: phone distraction behind the wheel. Our content is direct, research-driven, and practical. We prioritize accuracy over opinion and education over sensationalism. The goal is simple — reduce distracted driving incidents by increasing awareness and responsibility. If one article causes one driver to put their phone down, the mission is working. For inquiries or partnerships, contact: privacy@textingwithdriving.com
View all posts by Texting With Driving
