

Distracted Driving and Halloween 2026: Child Pedestrian Deaths, October 31 Risk and What Every Driver Must Do

Distracted Driving and Halloween 2026: Child Pedestrian Deaths, October 31 Risk and What Every Driver Must Do
Distracted driving Halloween 2026 is the most data-documented pedestrian safety crisis of the calendar year — a single night that produces more child pedestrian deaths than any other day, concentrated in a five-hour window between 5 and 9 PM, driven by the specific combination of child behavior, darkness, and driver inattention that October 31 consistently produces.
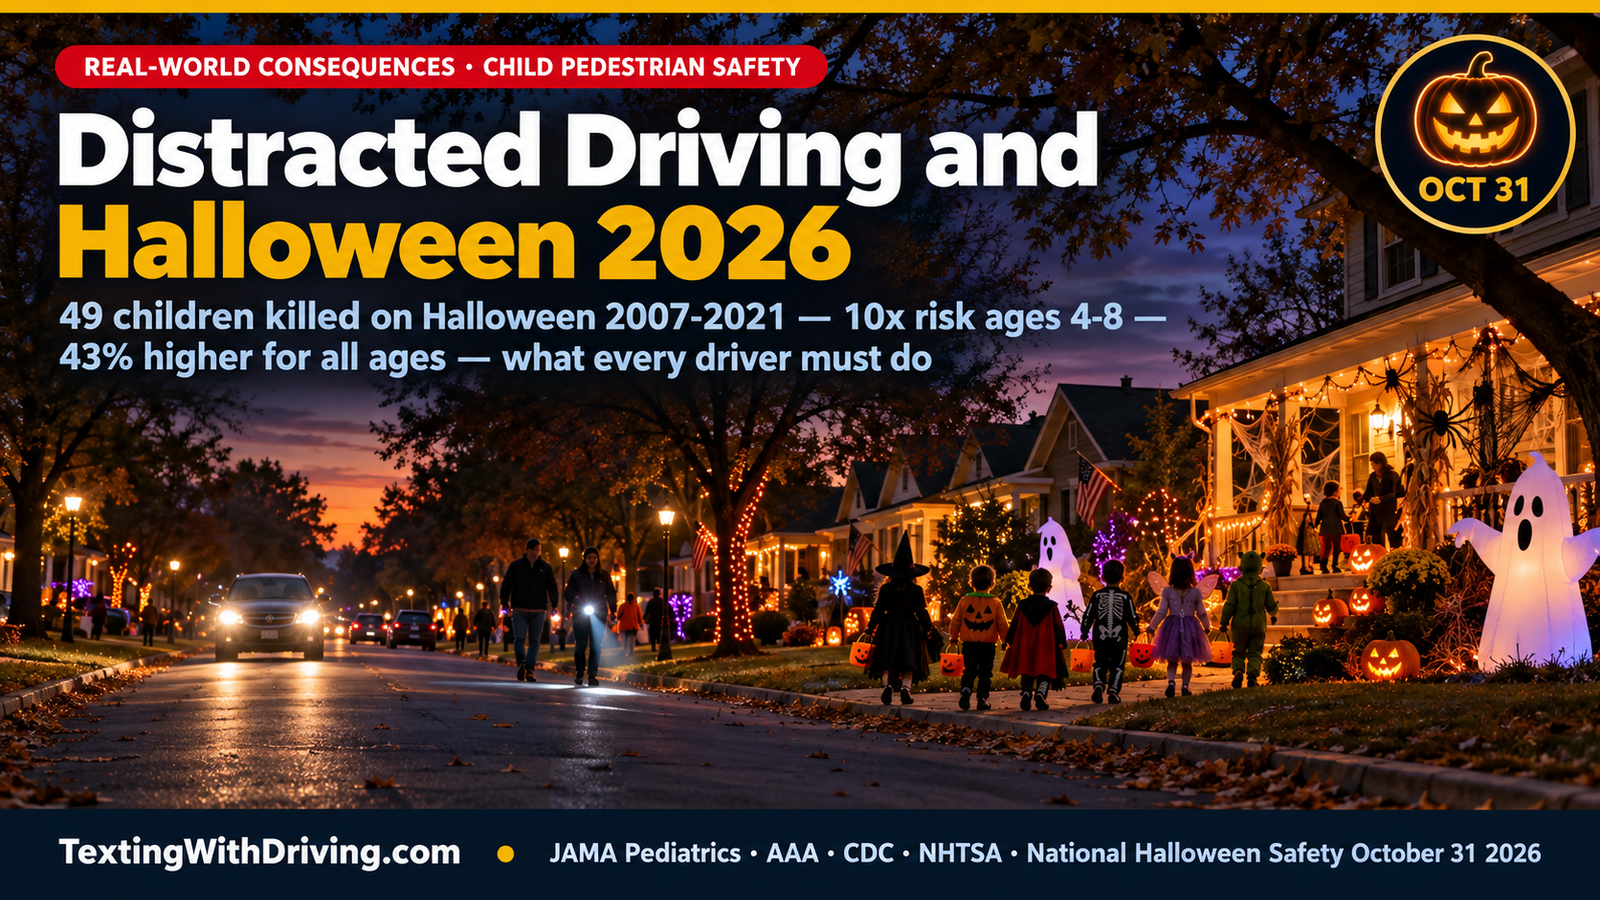
49 children under the age of 17 were killed on Halloween between 2007 and 2021 — nearly double the child pedestrian death toll of the next deadliest day of the year. That AAA analysis of federal crash data establishes October 31 as the deadliest single day for child pedestrians by the largest margin of any annual event in the traffic safety calendar. Not slightly more dangerous — nearly twice as dangerous as the next deadliest day.
The JAMA Pediatrics study of 42 years of NHTSA data adds the specific risk quantification: children aged 4 to 8 face a 10-fold increase in pedestrian fatality risk on Halloween night compared to comparable evenings one week before and after October 31. For all ages, pedestrian fatality risk is 43 percent higher on Halloween. The average Halloween results in 4 additional pedestrian deaths beyond what comparable control evenings produce.
Distracted driving is one of the three primary behavioral causes of these deaths — identified alongside drunk driving and the specific risk behaviors of the pedestrian — by the researchers who have most carefully studied the mechanism behind Halloween’s consistently elevated pedestrian death toll.
This guide covers the complete distracted driving Halloween 2026 picture from the national perspective: what the research establishes about the death risk, why distracted driving is specifically implicated, the 6 PM deadliest hour, the Friday October 31 dimension, what the statistics mean for every residential street in America on the night of October 31, and what specific actions every driver must take.
The Research Foundation: 42 Years of Halloween Pedestrian Deaths
Distracted driving Halloween 2026 has its research foundation in two landmark studies that together provide the most comprehensive available picture of Halloween pedestrian risk.
The JAMA Pediatrics study (published 2018, covering 1975-2016): Researchers Yip and Staples analyzed 42 years of NHTSA fatality analysis reporting system data, comparing pedestrian deaths during the 5 PM to 11:59 PM window on October 31 each year against control dates one week earlier (October 24) and one week later (November 7). The findings:
608 pedestrian fatalities on 42 Halloween evenings versus 851 on 84 control evenings — establishing the 43 percent higher fatality risk (odds ratio 1.43, 95% confidence interval 1.29-1.59, p < 0.001).
Children aged 4 to 8: odds ratio 10.00 (95% CI 5.23-19.11) — a finding the researchers describe as representing a tenfold increase in the risk of vehicular death while trick-or-treating. The precision of this finding — a 10-fold increase with statistical confidence from 5.23x to 19.11x — is one of the most striking risk quantifications in the entire pedestrian safety literature.
The deadliest hour is 6 PM. The hourly variation in mean pedestrian fatalities on Halloween shows the peak at 6 PM — the exact hour that combines maximum trick-or-treating activity with maximum early-darkness conditions in late October.
The relative risk has remained stable across 42 years despite safer vehicles, better roads, and improved enforcement. The ratio of Halloween fatalities to control date fatalities has not improved — meaning that whatever improvements in road safety have occurred over five decades have not addressed the specific Halloween child pedestrian death concentration.
The AAA Foundation analysis (2007-2021):
Between 2007 and 2021, the deadliest day for child pedestrians aged 17 and under is October 31. A total of 49 children were killed on Halloween during that period — nearly double the next deadliest day.
October 31 is the second deadliest day for pedestrians of all ages.
Between 2002 and 2022, 57 pedestrians aged 17 and under were involved in fatal crashes on October 31.
The CDC historical data (1975-1996):
In the early period of Halloween pedestrian death research, the CDC documented a fourfold increase in childhood pedestrian deaths on Halloween evenings compared with all other evenings for children aged 5 to 14. The 89 deaths among pedestrians aged 5 to 14 on Halloween evenings in that 22-year period, compared with 8,846 on all other evenings, established the scale of the problem that subsequent research has refined but not diminished.
The Day-of-Week Factor: Halloween 2026 Is a Friday
Distracted driving Halloween 2026 carries a specific calendar amplification that makes this year’s Halloween the highest-risk day-of-week scenario in the research record.
Research examining pedestrian deaths by day of the week when Halloween falls finds: when Halloween falls on a Friday, it produces a 23 percent increase in pedestrian deaths compared to all Fridays. Friday is the worst day-of-week scenario for Halloween pedestrian safety.
Halloween 2026 is a Friday.
The Friday amplification mechanism:
The Friday commute produces the highest end-of-week traffic volume on residential streets in the 5 to 7 PM window — the period that overlaps precisely with peak trick-or-treating and the 6 PM deadliest hour.
Friday evening carries the highest alcohol presence among drivers — the after-work social event pattern that produces the impaired driving contribution to the 43 percent risk increase. Alcohol-impaired drivers contributed to approximately 38 drunk driving deaths on Halloween night 2021 alone — roughly one-third of all motor vehicle deaths on that Halloween.
Friday afternoon social coordination generates the highest phone-interaction traffic of the week — texts about weekend plans, evening navigation, social calendar management — producing maximum phone-in-hand behavior at the deadliest Halloween pedestrian hour.
The 23 percent Friday Halloween increase applied to the baseline 43 percent Halloween increase produces a compound pedestrian death risk that makes Friday, October 31, 2026 the most dangerous trick-or-treating environment since the last Friday Halloween.
Why Distracted Driving Is Specifically Implicated
Distracted driving Halloween 2026’s specific behavioral mechanism requires understanding why the three-pronged recommendation — don’t drive drunk, high, or distracted — groups distracted driving alongside impaired driving as the primary Halloween driver failure modes.
The Halloween pediatric death scenario has a specific mechanism that distracted driving directly amplifies:
Step 1: The child appears from between parked cars. The most common Halloween child pedestrian fatality mechanism is a child darting from between parked cars into the travel lane — moving from the sidewalk into the road in the gap between two parked vehicles. The child is invisible to the approaching driver until they appear at the edge of the vehicle gap, which may be as little as 30 to 50 feet from the approaching vehicle at typical residential street speeds.
Step 2: The attentive driver’s reaction. An attentive driver traveling at 20 mph approaches the parked-car gap with their visual scan covering the gaps between vehicles. They detect the child’s movement before the child enters the travel lane — the peripheral motion of a small person stepping off the curb registers at 100 to 150 feet under good visibility conditions. The attentive driver reduces speed. The child crosses safely.
Step 3: The distracted driver’s non-reaction. The driver who is looking at their phone for the two to three seconds before the child appears has zero detection time for the child’s movement in the parked-car gap. When the child enters the travel lane, the distracted driver may not detect them until the child is at arm’s length — producing the zero-braking-distance collision that is the specific mechanism behind the 10-fold increase in child pedestrian deaths among the 4-to-8 age group.
Dr. John Staples, lead researcher of the JAMA Pediatrics study, is direct: don’t drive drunk, high or distracted — and make sure you slow way down when you drive through pedestrian neighborhoods. The dual instruction — don’t be distracted AND slow way down — reflects the research finding that both elements are independently required for pedestrian safety. Slowing down gives more reaction time. Not being distracted preserves the reaction capacity that even reduced speed alone cannot replace.
The 42-year stability of the Halloween pedestrian death risk ratio is the most compelling evidence for distracted driving’s specific role: as vehicles have become safer, roads have been improved, and drunk driving has declined, the ratio of Halloween pedestrian deaths to comparable evenings has not improved. The behavioral risk factor that has grown over the same 42-year period — phone use while driving — is the most plausible explanation for why the ratio has remained stubbornly stable despite all the safety improvements that have reduced it in other crash scenarios.
The 6 PM Hour: The Deadliest Convergence
Distracted driving Halloween 2026 concentrates its peak risk at 6 PM — a specific hour that represents the maximum convergence of every risk factor simultaneously:
Maximum trick-or-treating pedestrian density. The most common start time for trick-or-treating across the United States — the hour when the largest number of households turn on their porch lights and the largest number of children begin their routes — is 6 PM. The pedestrian density on residential streets peaks between 6 and 8 PM.
Maximum early-darkness driver adjustment challenge. Late October’s 6 PM is already in full darkness in the northern United States. In the first week after the DST transition (November 2 this year, 20 days after Halloween), 6 PM will be even darker — but Halloween’s 6 PM is already at the deep-dusk-to-full-darkness transition that catches drivers who adjusted their behavior based on the prior week’s later sunset.
Maximum commute-return traffic volume. The Friday 6 PM commute return — this year’s specific Halloween context — places the maximum number of work-bound vehicles on residential streets at the maximum trick-or-treating pedestrian density hour. Drivers who have been in their vehicles since 5 PM, managing a Friday-before-Halloween commute with social coordination phone traffic, arrive in residential neighborhoods at exactly 6 PM.
Maximum child excitement and impulsive behavior. The 4-to-8 age group that faces the 10-fold death risk is at peak Halloween excitement at 6 PM — the first hour of trick-or-treating, the moment of maximum candy-anticipation energy that produces the dart-into-the-road behavior before executive function catches up to impulse. A 5-year-old who sees a decorated house across the street may run directly toward it without any assessment of traffic conditions.
The 6 PM convergence is not a coincidence. It is the specific alignment of pedestrian behavior, driver behavior, lighting conditions, and traffic volume that produces the deadliest hour of the deadliest day for child pedestrians.
The National Picture: Every Neighborhood Is at Risk
Distracted driving Halloween 2026 is not concentrated in high-crime neighborhoods, unfamiliar communities, or high-traffic areas. The JAMA Pediatrics data establishes that the Halloween pedestrian death risk is distributed across the full range of American residential environments — suburban neighborhoods with sidewalks, small-town streets without sidewalks, urban residential blocks, and rural residential areas.
The 49 children killed on Halloween between 2007 and 2021 died in residential neighborhoods across the country — including neighborhoods their parents and guardians considered safe. The specific risk profile of the Halloween scenario — maximum pedestrian density, darkness, and the specific child behavioral risk factors — applies equally to the well-lit suburban neighborhood with new sidewalks and traffic calming as to the older commercial-residential corridor with no sidewalks.
The implied safety of familiar neighborhoods is a specific Halloween pedestrian death risk factor: parents who are comfortable in their own neighborhood allow more independent movement by their children — a six-year-old who is allowed to run to the next house unaccompanied is in the specific 10-fold risk scenario regardless of whether the neighborhood is “safe” by any other measure.
What Every Parent Must Tell Every Child
Distracted driving Halloween 2026’s most actionable guidance for parents addresses the pedestrian side of the Halloween fatality equation. Children cannot control the distracted driving behavior of approaching vehicles. But children’s pedestrian behavior is something parents can directly address before October 31.
Cross only at intersections and crosswalks, never mid-block. The parked-car gap crossing that produces the most common Halloween child pedestrian fatality mechanism is a mid-block crossing. An absolute rule — only cross at intersections, only cross when an adult gives permission — eliminates the most common fatality scenario.
Wear reflective material or carry a flashlight. The darkness-concealment risk that dark costumes create is directly addressable. Reflective tape on costumes, glow sticks, flashlights, and light-colored accessories all extend the driver’s detection range beyond the near edge of the headlight beam. A child in a dark costume who first becomes visible to a driver at 50 feet has far less safety margin than a child with reflective accessories who is visible at 200 feet.
Wait for all traffic to stop before crossing. The child who begins crossing when a car has stopped at the intersection but another car is approaching in the other lane is in the Halloween pedestrian risk scenario. All lanes must be clear before any child steps off the curb.
Stay with the group and an adult at all times. The child who separates from the group — running ahead to the next house, crossing the street independently while parents are talking to neighbors — is in the specific individual-crossing scenario that produces the highest-risk pedestrian exposure.
What Every Driver Must Do on October 31
Distracted driving Halloween 2026 requires five specific behavioral commitments from every driver who will be on the road on Friday, October 31, 2026:
First: Activate Driving Focus or Android DND before leaving for any drive after 4 PM. The Friday social coordination phone traffic peaks from 4 to 7 PM — exactly the trick-or-treating window. Driving Focus eliminates all of it.
Second: Reduce speed to 15-20 mph on every residential street. Not 25 mph. Not the posted limit. 15 to 20 mph — the speed at which a driver has 8 to 10 seconds to detect a child appearing from a parked-car gap at 60 feet. At 25 mph, the same distance provides 1.6 seconds. The extra speed difference between 20 and 25 mph is the difference between life and death for a 5-year-old.
Third: Scan every parked-car gap continuously. Standard driving does not require active scanning of the gaps between parked cars. Halloween driving does. Each gap is a potential child-emergence point. Scan each one before passing it at residential-street speed.
Fourth: Do not drive through residential neighborhoods between 5 and 9 PM if the trip is not necessary. The 43 percent higher pedestrian fatality risk is concentrated in this window. Use alternate routes. Delay the trip. The 15 minutes of route inconvenience is trivially small compared to the consequence of encountering a child in a dark costume at an unmarked gap between parked cars.
Fifth: Extend following distance to 4 to 5 seconds behind the vehicle ahead. The vehicle ahead will stop suddenly when a child runs into the road — the driver ahead may see the child at 100 feet while you are 50 feet behind them. An extended following distance provides the reaction margin that prevents the chain-reaction crash when the vehicle ahead stops suddenly.
For the Virginia and DMV-specific Halloween safety context, our Halloween driving safety distracted driving 2026 article covers the regional picture including the I-395 pedestrian concentration and Virginia’s specific enforcement environment. For the broader pedestrian darkness safety picture leading up to Halloween and the November 2 DST transition, our Virginia pedestrian safety darkness 2026 article covers the fall season pedestrian risk. For the complete national distracted driving statistics that contextualize Halloween’s child pedestrian deaths within the broader toll, our distracted driving statistics 2026 covers the full picture. And for the technology setup that makes Driving Focus the automatic standard on every Halloween drive, our hands-free while driving complete setup guide covers iPhone, Android, Bluetooth, and CarPlay.
Sources Used in This Article
All links verified working before publication.
JAMA Pediatrics / PubMed Central: Pedestrian Fatalities Associated With Halloween in the United States — 42-year NHTSA study 1975-2016, 608 Halloween fatalities vs 851 control, 43% higher risk odds ratio 1.43, children 4-8 10-fold increase odds ratio 10.00, 4 additional deaths average, deadliest hour 6 PM, 5PM-11:59PM primary analysis
JAMA Network: Full Study Pedestrian Fatalities Halloween — Full text confirmation, stable relative risk across 42 years, event-specific interventions traffic calming automated speed enforcement, published October 30 2018
Boston25 News / AAA: Halloween Deadliest Day Child Pedestrians — AAA Northeast 2007-2021 49 children killed nearly double next deadliest day, 2002-2022 57 under-17 fatal crashes Oct 31, Oct 31 second deadliest all ages, 38 drunk driving deaths Halloween 2021
Wisconsin Public Radio: Halloween Pedestrian Fatalities Higher Children — Average 4 additional deaths, risk highest 6PM, Friday Halloween 23% more deaths vs regular Fridays, Saturday Halloween 4% less likely, October-December deadliest months
NBC News: Halloween Deadly Night Children Traffic Researchers — Dr. Staples don’t drive drunk high distracted slow down quote, 43% risk increase stable 42 years despite safer vehicles, tenfold increase children 4-8
JGL Law: Children Twice as Likely Struck Killed Halloween — Children twice as likely struck killed any other day, 5-9PM most fatalities, October National Pedestrian Safety Month NHTSA, most dangerous days Friday Tuesday Sunday Thursday, NSC discourage new inexperienced drivers
CDC MMWR: Childhood Pedestrian Deaths Halloween 1975-1996 — 89 deaths ages 5-14 Halloween evenings vs 8,846 all other evenings, fourfold increase, developmental risk factors child pedestrians
NHTSA: Distracted Driving — 3,208 deaths 2024, 315,167 injuries, national context
TextingWithDriving.com is professionally built and maintained to ensure accurate, accessible safety information reaches every driver who needs it. Website development and ongoing support is handled by Budgetic, a digital agency specializing in purpose-driven WordPress websites.
